Shine on you crazy diagram – part 5
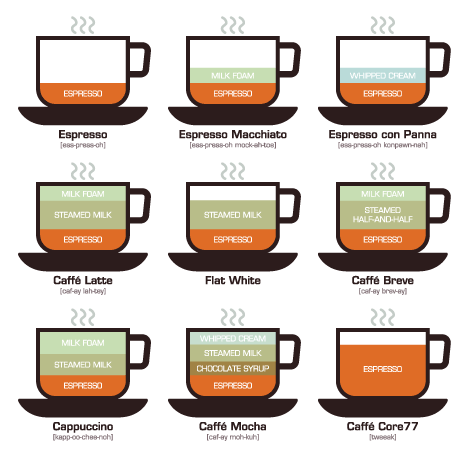
Ah, visualizations and their power to guide and structure creative thinking, and sometimes they’re so timely. So as I am starting off to a trip to Milano tomorrow for the second International Forum on Enterprise 2.0, it’s a good idea to learn more about caffé (even when it’s not included in these 50 great examples of infographics …):
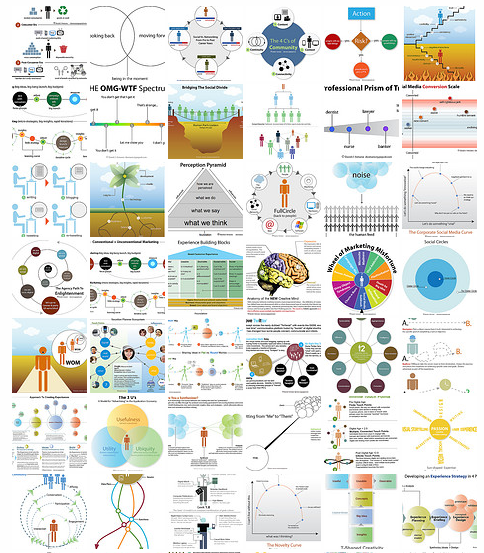
In the past I blogged about several of David Armano’s visualizations, here’s an overview of his works, great variety:
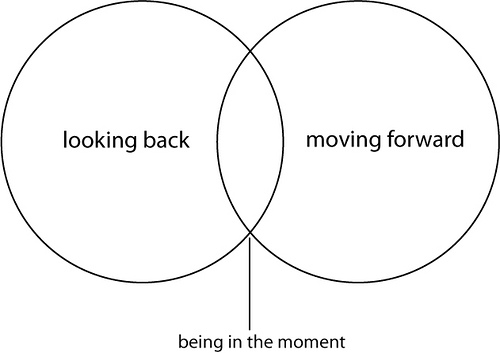
Cool stuff, like his take on time:
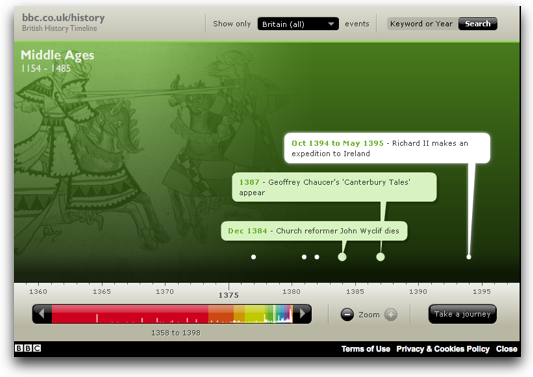
Being in the moment, looking back and forth – here’s something fitting, found via Soulsoup: an animated British History Timeline by the BBC , let’s call it an interactive flash explainer:
Need even more animations? Try Rotkäppchen explained:
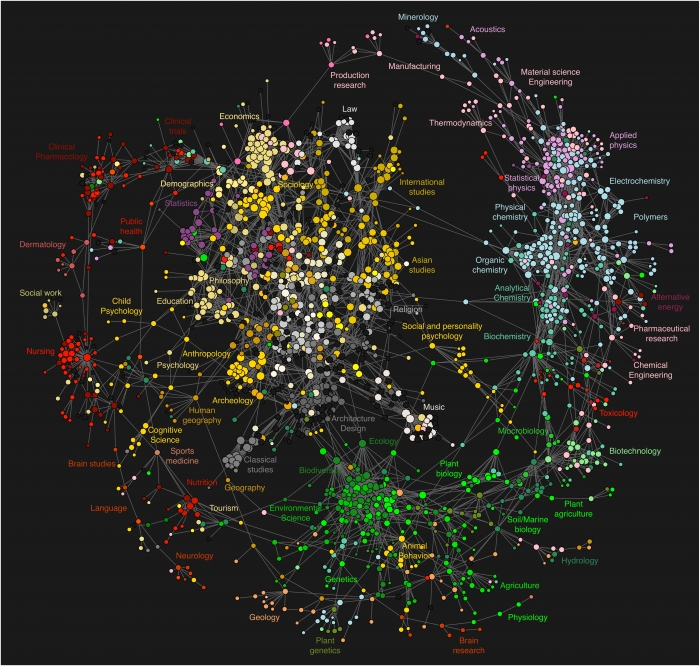
But it’s not all fun stuff, it’s about science indeed – take this as proof, found via Orgtheory.net and via Scatterplot – a visual representation of the relationships between the sciences (the article is here):
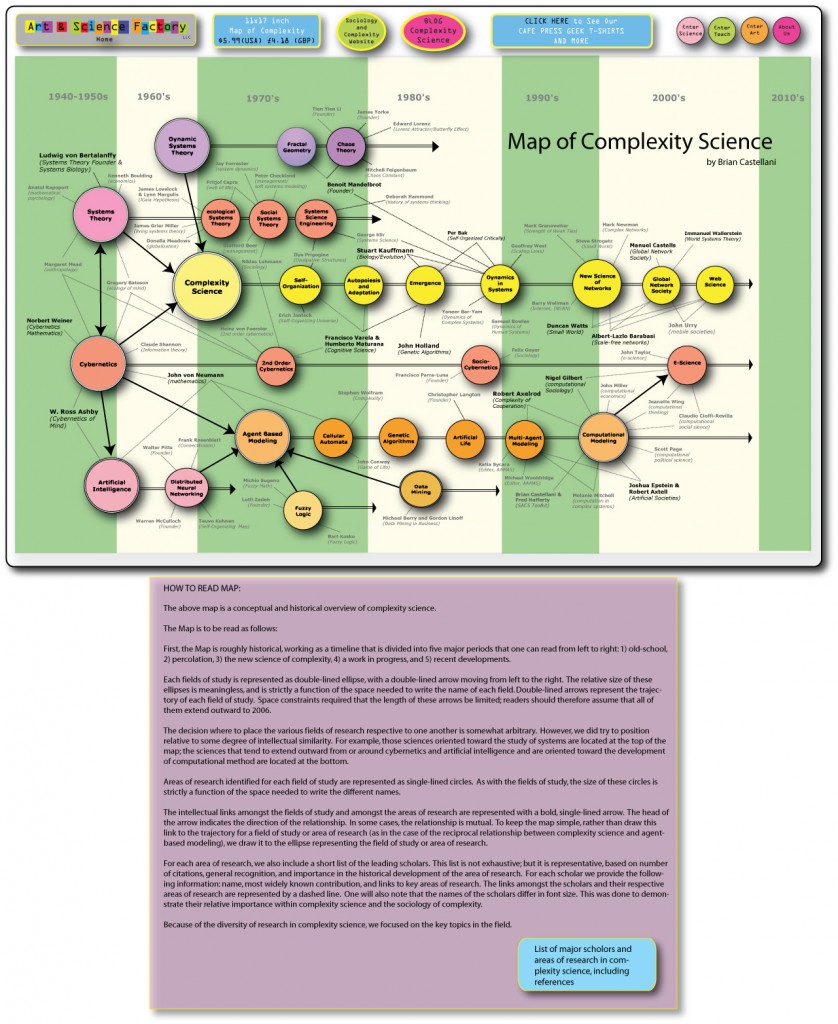
And for an even closer look inside, try this road map of complexity science I found via Walter Baets (what does it really mean, what is included, what could be included, etc. – you better click through for closer examination):


[…] 2.0 experiences. Even when we know that it’s the networking in the coffee breaks (I learned a bit about caffé you know …) what makes conferences worthwhile […]